All Out July 7th: Stocks Are Flying High
The stock market has had an amazing first half. The S&P 500 was up 16.79% and the Nasdaq up 39.14% (SPY and QQQ). This has been a pretty crazy rally and is coming off a terrible year for asset markets. We wanted to point out a couple of interesting facts.
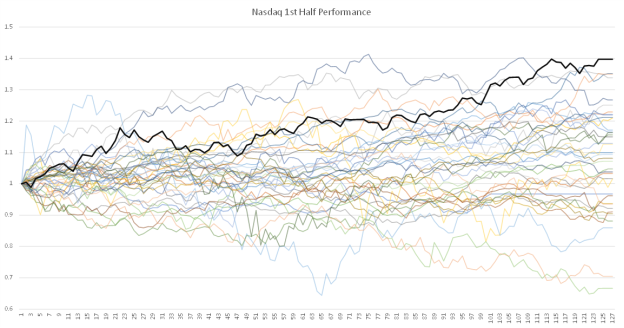
1- This is the best start of the year for the Nasdaq 100 since 1985. The following chart shows the first six months of the year for the Nasdaq 100 since 1985. Apart from the small drawdown around march (SVB fiasco) it has been a steady drift upwards.
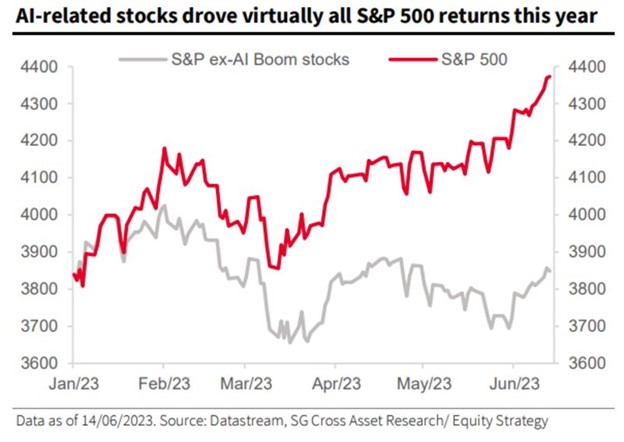
2- Virtually all of the return this year has been driven by AI stocks. The S&P 500 just shy of 4400 a couple of weeks before the end of June. However, if we exclude AI boom stocks (as classified by SocGen) then the S&P is roughly flat for the year.
3- Related to this, the top 8 stocks in the S&P 500 have contributed 10.82% to the total return of the SPY. The other remaining 496 stocks (there are 504 stocks in the S&P 500), have contributed only 2.88%.
4- The US bond market has been in a drawdown for 35 months, the longest in history (as measured by the US Aggregate Bond Index). The second longest was from July 1980 until October 1981. It has also been the deepest in history with a drawdown of 17.2%. The second deepest was from august 1979 until august 1980 at -12.7%.
The “only X number of stocks have made up most of the gains” statistic is pretty popular in financial media. A recent report by Goldman Sachs (GS) shows that since 1995 on average just 10 stocks account for 32% of the S&P 500’s return each year. According to GS, this year the top 10 stocks have accounted for 82% of the return. Every other year in which this happened (10 stocks accounting for 82% or more of returns), the S&P ended down on the year. The other years were:
- 2015: -0.73%
- 2011: -0.11%
- 2000: -10.13%
Does this mean that the S&P 500 will end down on the year? It is certainly what this statistic suggests, however it is just one statistic with not many observations. We do think the market has run up too far too fast and that headwinds remain. Like we always say, timing the market is impossible, we would rather invest in strategies that make sense and stick with them.

Moody’s Warns Of ‘serious Challenge’ To $1.4tn Private Credit Market
Private credit has grown in popularity in recent years. A private credit fund provides financing to companies which are unable to access traditional bank financing. The private credit market has seen quite large growth since 2008. It is estimated to be around $1.4 trillion, and was roughly $320 billion back in 2008. Banks have been pulling out of financing these companies because of regulatory changes after the 2008 crisis. Private funds have since stepped in to provide this service and investors have flocked to the asset class since this period was marked by very low interest rates. Therefore, investors were reaching for yield and these funds provided higher interest rates than pretty much any other public market alternative. Private credit funds also suffer from the volatility laundering effect we’ve written about before.
The way to get higher yields is to essentially take on more risk. This risk can come from financing riskier companies or by using leverage. What happened in the 2010s is that as rates were low for so long, investors started looking for riskier investments to make up for the low yields. The mania we experienced in 2021 made things worse. The flood of money from 2020 mixed with low rates and the euphoria of beating covid led to many speculative bubbles. Amongst these was the SPAC mania, EV mania, etc. After the increase in rates in 2022 and 2023 (rate increases might not have ended), we’ve seen many of these bubbles deflate. The De-SPAC Index (tracks companies after they merged with the SPAC) is down 67% since the end of 2021 and down 84% from its high in March 2021. We’ve seen EV companies take a hit with fraud allegations and bankruptcies. What we haven’t seen yet are cracks in the private credit markets, which are coming, it’s just a question of when.

Deutsche Bank tells investors some of their Russian shares are missing
When you want to buy shares listed in a foreign country there are essentially 2 ways of doing it. The first is to open an account at a brokerage in that foreign country, wire some money, exchange it to local currency, and purchase the shares. This is a bit tedious, if you want shares in several countries you need several brokerage accounts and you need to move money to different places, currencies, etc. What you can also do is buy a depositary receipt (DR). In the US this is pretty common and there are many American Depositary Receipts (ADRs). DRs are issued by banks and represent ownership in a foreign stock. The banks hold the foreign shares and list the DRs in the local exchange. For example, Taiwan Semiconductor trades on the Taiwan stock exchange under the ticker 2330 TT. In the US it trades at the NYSE under the ticker TSM US. TSM US is an ADR and one share of TSM US represents 5 shares of 2330 TT and is held at Citibank. This makes it easy to buy Taiwan Semi right from your US brokerage account in US dollars during US trading hours.
One of the risks from investing in emerging markets is that you are subject to the whims of foreign governments. Investors which invested in Russia are finding this out. If you had invested in RSX, an ETF that invested in Russian stocks, you would have lost 98% in 2022, investors were essentially wiped out after Russia invaded Ukraine and the sanctions were imposed. Now it seems holders of DRs of Russian stocks are having issues. Deutsche Bank, one of the DR issuers has informed its clients that some of the underlying shares may be missing. Another investing fallout from the Russia – Ukraine war. These are added risks (apart from the traditional stock, currency and political risks) from investing in emerging markets.